Exercise 3 - Observability
In this exercise you enable and use the Observability function in Red Hat Advanced Cluster Management. You will configure observability, explore the built-in dashboards, enable custom alerts using Thanos Ruler and design custom dashboards for your own organizational needs.
3.1 - Deploying Observability
This part focuses on the Observability addon deployment. Observability requires S3-compatible object storage for Thanos metric retention. This workshop uses OpenShift Data Foundation (ODF) NooBaa which is already available on the hub cluster. A setup script automates the entire process: creating a NooBaa Object Bucket Claim, extracting credentials, and deploying the MultiClusterObservability CR.
Prerequisites
-
ODF with NooBaa must be running on the hub cluster (verify with
oc get noobaa -n openshift-storage) -
The
openshift-storage.noobaa.iostorage class must be available
Run the setup script
The script handles all steps — namespace creation, pull secret, bucket provisioning, Thanos secret, and MCO deployment:
<hub> $ bash 03.Observability/exercise/setup-observability.shThe script will:
-
Create the
open-cluster-management-observabilitynamespace -
Copy the cluster pull secret
-
Create an ObjectBucketClaim via NooBaa and wait for it to bind
-
Extract bucket credentials and create the
thanos-object-storagesecret -
Auto-detect the storage class for StatefulSets
-
Apply the
MultiClusterObservabilityCR
After the script completes, verify the thanos-object-storage secret was created correctly:
<hub> $ oc extract secret/thanos-object-storage --to=- -n open-cluster-management-observability

# thanos.yaml
type: s3
config:
  bucket: observability-<uuid>
  endpoint: s3.openshift-storage.svc:80
  insecure: true
  access_key: <generated>
  secret_key: <generated>
Make sure that all observability pods reach Running state (this takes 3-5 minutes):
<hub> $ oc get pods -n open-cluster-management-observabilityYou should see ~34 pods running including observability-grafana, observability-thanos-, observability-alertmanager-, and the endpoint-observability-operator.
Now, that all pods are running, log into RHACM’s dashboard and navigate to Clusters → Grafana (top right side). Make sure that the dashboards are available and graphs are present.
For additional install methods refer to the official documentation
You can also refer to this quick start for AWS Deployments and ODF Deployments Install MultiCluster Observability
3.2 - Explore the default Grafana dashboards
This part focuses on the default Grafana dashboards that come with RHACM. Each dashboard has its own characteristics and provides valuable information to a system administrator in the organization. This section contains multiple tasks that require you to look for certain values in the default dashboards that come with MCO.
-
Find the maximum latency value for the
local-clusterAPI server. -
Find out how much % of `local-cluster’s memory is utilized.
-
Find what is the size of the etcd database in
local-cluster. -
Find the namespace that consumes the most CPU in
local-cluster. -
Find what’s the node in
local-clusterthat consumes the most % memory. -
Find what’s the
apiserver(openshift-apiserver namespace) pod CPU utilization and quota.
3.3 - Creating a custom alert
In this part you will configure custom alerts to monitor your environment. By configuring the alert, you will be able to receive a notification if a rule that you have configured is violated by one of managed clusters in RHACM.
3.3.1 - Alert #1
The first alert you will configure in the exercise will initiate a notification when a cluster’s memory utilization reaches over 20%. In order to create the alert, create the next ConfigMap in the open-cluster-management-observability namespace (Make sure to go through the alert before applying it!).
apiVersion: v1
data:
  custom_rules.yaml: |
    groups:
      - name: cluster-health
        rules:
        - alert: ClusterMemoryHighUsage
          annotations:
            summary: Notify when memory utilization on a cluster is greater than the defined utilization limit - 20%
            description: "The cluster has a high memory usage: {{ $value }} for {{ $labels.cluster }}."
          expr: |
            1 - sum(:node_memory_MemAvailable_bytes:sum) by (cluster) / sum(kube_node_status_allocatable{resource="memory"}) by (cluster) > 0.2
          for: 5s
          labels:
            cluster: "{{ $labels.cluster }}"
            severity: critical
kind: ConfigMap
metadata:
  name: thanos-ruler-custom-rules
  namespace: open-cluster-management-observability
Now that the alert is configured, check whether the alert is initiated or not. To check the alert, navigate to the Grafana instance you’ve deployed in the previous task. In the Grafana instance, go to the Explore page (compass icon on the left sidebar).
Switching to Code mode
By default, the Explore page opens in Builder mode, which shows visual dropdown selectors for metrics and labels. To paste raw PromQL expressions, you must switch to Code mode.
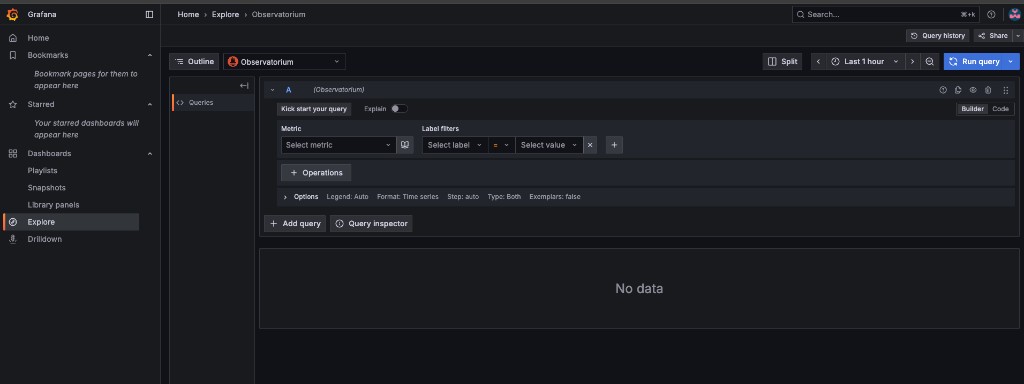
In the query editor area, locate the Builder | Code toggle on the right side (above the Options row). Click Code to switch to a raw text input where you can type or paste PromQL queries directly.
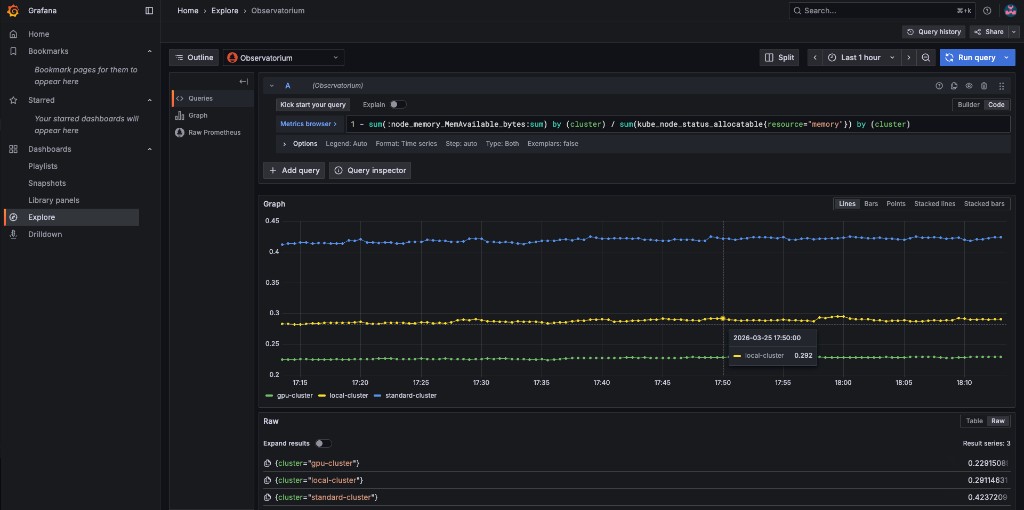
Verify memory utilization
Copy the next expression into the Code editor and press SHIFT + ENTER (or click Run query):
1 - sum(:node_memory_MemAvailable_bytes:sum) by (cluster) / sum(kube_node_status_allocatable{resource="memory"}) by (cluster)The result is a number that identifies the % of memory utilization of a cluster. For example, if the result is 0.1, the memory utilization of a cluster is 10%.
Try running the next query -
1 - sum(:node_memory_MemAvailable_bytes:sum) by (cluster) / sum(kube_node_status_allocatable{resource="memory"}) by (cluster) > 0.2The query checks whether the result of the previous query is more than 0.2 (20%). If the query checks out, it will present all clusters that utilize more than 20% of their memory.
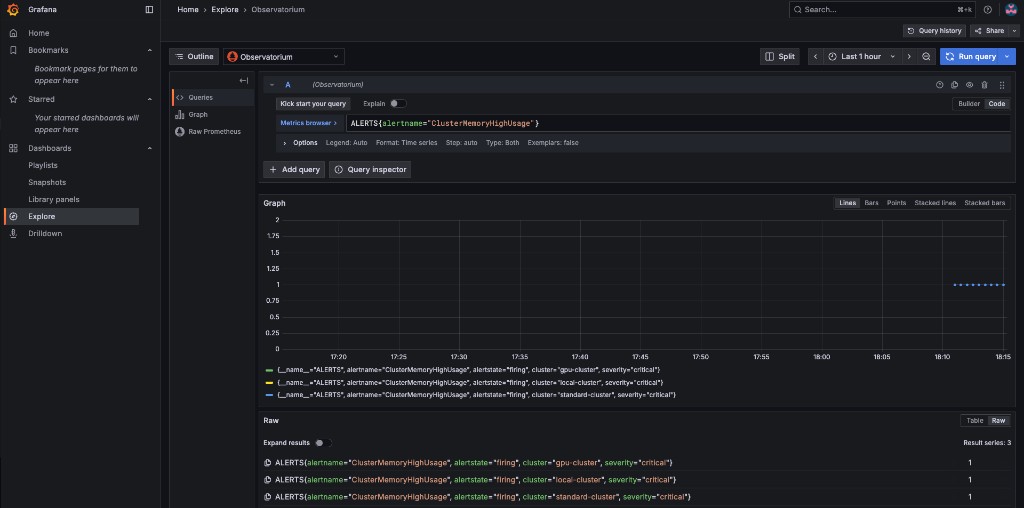
Verify the alert is firing
Now that you understand the mechanism behind alerting, try running a query that displays the active alerts in your environment. The query should display the alert that you’ve configured in the previous steps. Copy the next expression into the Code editor and press SHIFT + ENTER to run it.
ALERTS{alertname="ClusterMemoryHighUsage"}The initiated alert should now appear with a value of 1 for each cluster that exceeds the 20% memory threshold.
3.3.2 - Alert #2
The second alert will monitor the etcd database size. An alert will be initiated if the etcd database size on any cluster exceeds 100MiB. The metric to use is etcd_debugging_mvcc_db_total_size_in_bytes (you can find this in the ACM - Clusters Overview Grafana dashboard).
In order to deploy the second alert to MCO, add the new alert definition to the ConfigMap you created for the previous alert. Update the ConfigMap by applying:
apiVersion: v1
data:
  custom_rules.yaml: |
    groups:
      - name: cluster-health
        rules:
        - alert: ClusterMemoryHighUsage
          annotations:
            summary: Notify when memory utilization on a cluster is greater than the defined utilization limit - 20%
            description: "The cluster has a high memory usage: {{ $value }} for {{ $labels.cluster }}."
          expr: |
            1 - sum(:node_memory_MemAvailable_bytes:sum) by (cluster) / sum(kube_node_status_allocatable{resource="memory"}) by (cluster) > 0.2
          for: 5s
          labels:
            cluster: "{{ $labels.cluster }}"
            severity: critical
        - alert: EtcdDatabaseHighSize
          annotations:
            summary: Notify when the etcd database size on a cluster exceeds 100MiB
            description: "The etcd database size is {{ $value | humanize1024 }}B for {{ $labels.cluster }}."
          expr: |
            max(etcd_debugging_mvcc_db_total_size_in_bytes) by (cluster) > 100 * 1024 * 1024
          for: 5s
          labels:
            cluster: "{{ $labels.cluster }}"
            severity: warning
kind: ConfigMap
metadata:
  name: thanos-ruler-custom-rules
  namespace: open-cluster-management-observability
After applying, the thanos-rule pods will automatically pick up the new rule within ~60 seconds.
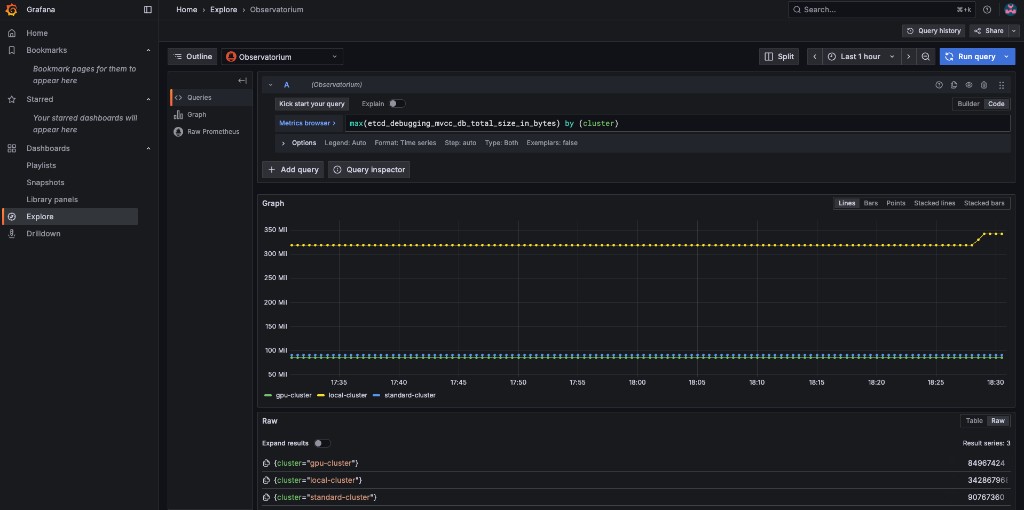
Verify the etcd alert
Navigate to Grafana Explore (compass icon), switch to Code mode, and run the following query to check the etcd database size across all clusters:
max(etcd_debugging_mvcc_db_total_size_in_bytes) by (cluster)You should see the raw etcd database size per cluster. In this example, local-cluster is well above the 100 MiB threshold:
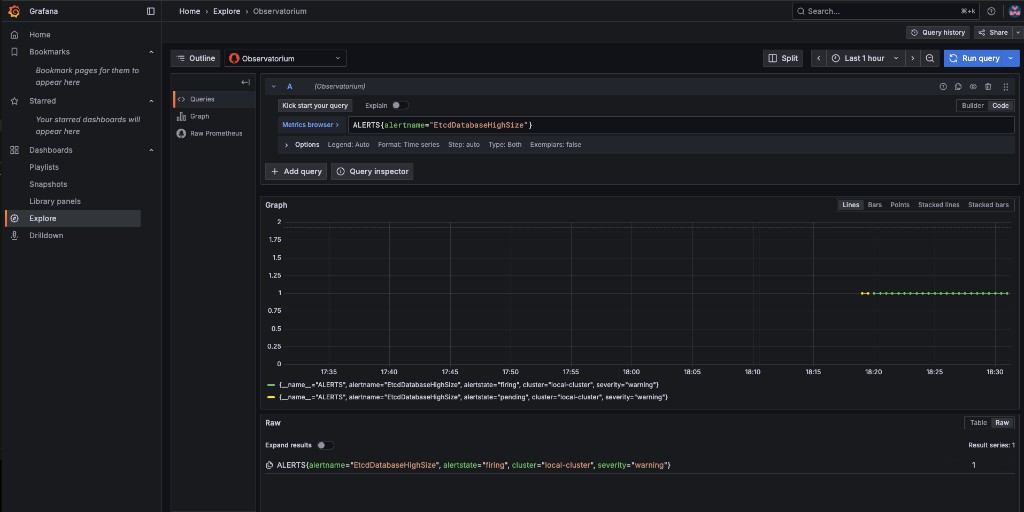
Now verify the alert is firing by running:
ALERTS{alertname="EtcdDatabaseHighSize"}The alert should show as firing for any cluster whose etcd database exceeds 100 MiB:
3.4 - Creating custom dashboards
In this section you will add custom dashboards to the production Grafana instance that comes with MCO. Custom dashboards are deployed by wrapping a Grafana dashboard JSON file in a ConfigMap with the label grafana-custom-dashboard: "true" and applying it to the open-cluster-management-observability namespace. The Grafana dashboard loader automatically picks up the ConfigMap and imports the dashboard into the Custom folder.
3.4.1 - Cluster Node Resources Dashboard (Memory and CPU)
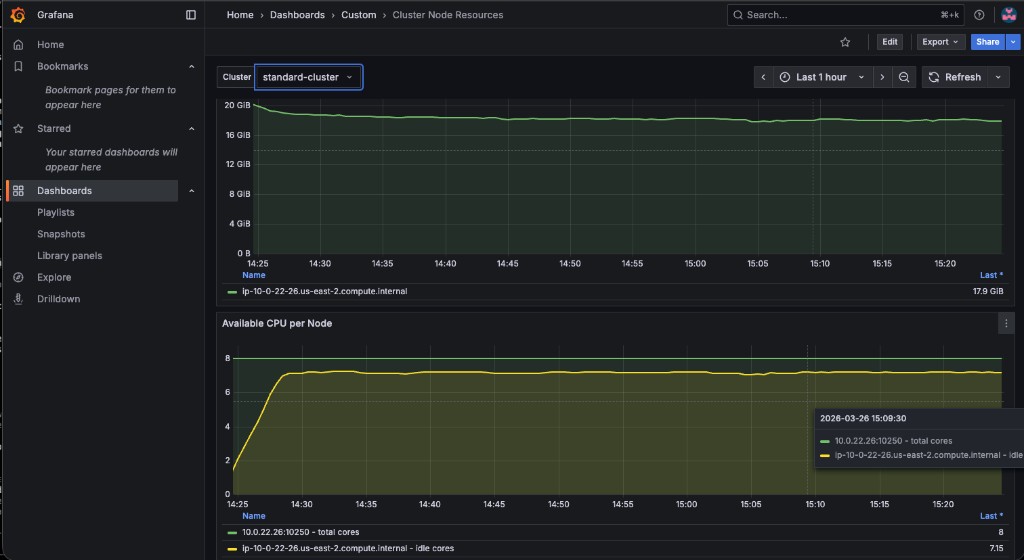
This dashboard contains two panels that show resource availability across cluster nodes:
-
Available Memory per Node — graphs
node_memory_MemAvailable_bytesper instance, with a cluster selector dropdown -
Available CPU per Node — graphs total CPU cores (
machine_cpu_cores) and idle CPU cores per instance
A pre-built dashboard JSON is provided at 03.Observability/exercise/cluster-node-resources-dashboard.json. Apply it as a ConfigMap:
<hub> $ oc create configmap cluster-node-resources \
--from-file=cluster-node-resources.json=03.Observability/exercise/cluster-node-resources-dashboard.json \
-n open-cluster-management-observability \
--dry-run=client -o yaml | \
oc label -f - --local --dry-run=client -o yaml grafana-custom-dashboard=true | \
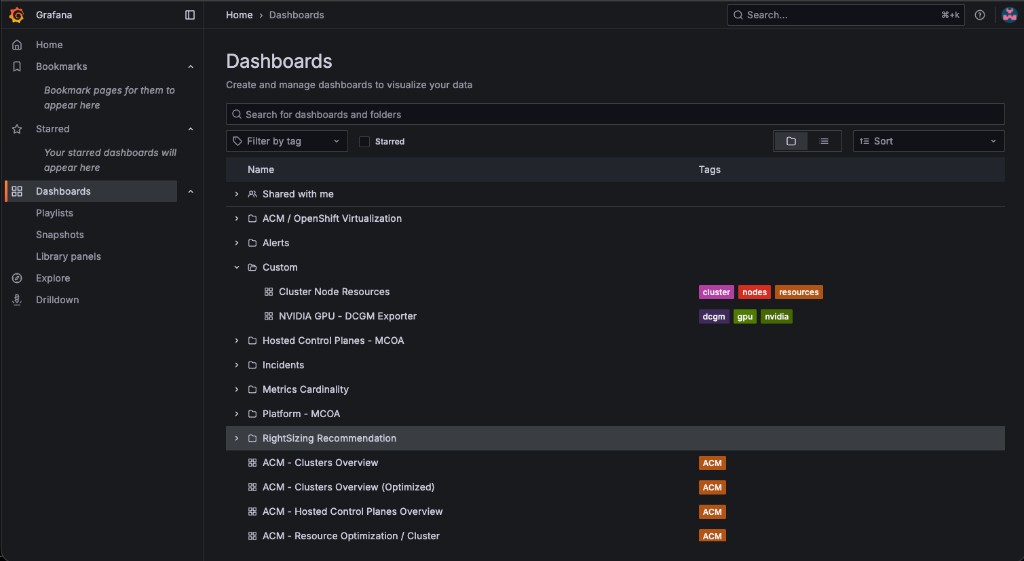
oc apply -f -After applying, navigate to the production Grafana instance → Dashboards → Custom folder. Both custom dashboards should appear:
Open the Cluster Node Resources dashboard. Use the Cluster dropdown at the top to select standard-cluster:
Verify the values match by querying the standard-cluster metrics via Thanos:
<hub> $ THANOS_POD=$(oc get pod -n open-cluster-management-observability -l app.kubernetes.io/name=thanos-query -o jsonpath='{.items[0].metadata.name}')
<hub> $ oc exec -n open-cluster-management-observability $THANOS_POD -c thanos-query -- \
  curl -s -G 'http://localhost:9090/api/v1/query' \
  --data-urlencode 'query=node_memory_MemAvailable_bytes{cluster="standard-cluster"}'
Try switching between local-cluster, standard-cluster, and gpu-cluster in the Cluster dropdown to compare resource availability across your fleet.
3.4.2 - Bonus: GPU Monitoring Dashboard
In this section you will import a pre-built NVIDIA GPU dashboard that visualizes DCGM (Data Center GPU Manager) metrics from managed clusters with GPUs. This ties back to the gpu-cluster provisioned in Exercise 1.
Enable GPU metric collection
By default, ACM Observability only collects a curated set of metrics. DCGM metrics must be added to a custom allowlist so the metrics-collector on the gpu-cluster ships them to the hub:
<hub> $ oc apply -f 03.Observability/exercise/gpu-metrics-allowlist.yamlWait 2-3 minutes for the metrics-collector on the gpu-cluster to pick up the new allowlist and start forwarding DCGM metrics.
Apply the GPU dashboard
A dashboard JSON file adapted from the official NVIDIA DCGM Exporter dashboard is provided at 03.Observability/exercise/nvidia-dcgm-dashboard.json. It has been modified to use the Observatorium datasource and a cluster template variable for multi-cluster filtering.
Apply it as a ConfigMap:
<hub> $ oc create configmap nvidia-gpu-dcgm-exporter \
--from-file=nvidia-gpu-dcgm-exporter.json=03.Observability/exercise/nvidia-dcgm-dashboard.json \
-n open-cluster-management-observability \
--dry-run=client -o yaml | \
oc label -f - --local --dry-run=client -o yaml grafana-custom-dashboard=true | \
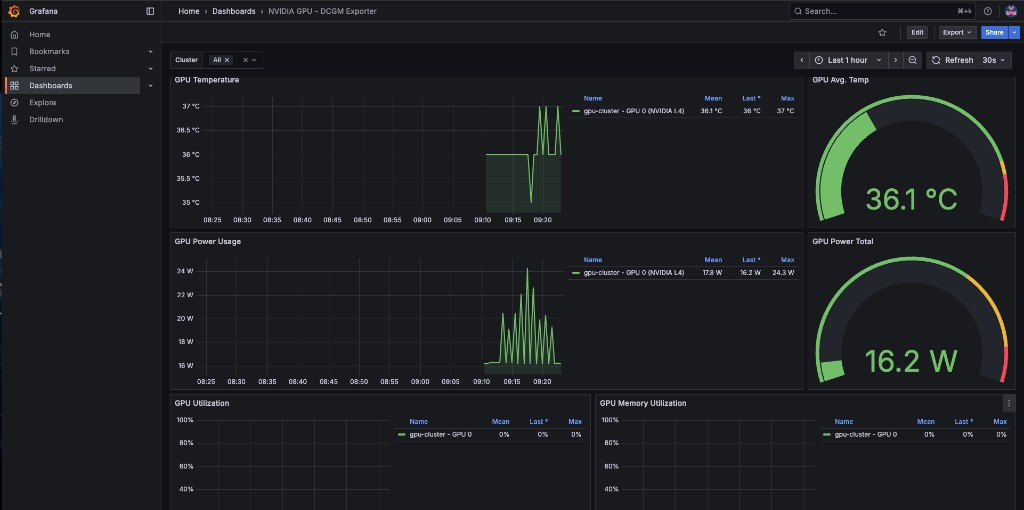
oc apply -f -The dashboard includes 8 panels: GPU Temperature, Avg Temp gauge, Power Usage, Power Total gauge, GPU Utilization, Memory Utilization, Framebuffer Memory Used, and SM Clocks. Navigate to Dashboards → Custom in the production Grafana and use the Cluster dropdown to filter by your gpu-cluster.
The GPU Operator policy (gpu-operator-policy.yaml) includes serviceMonitor.enabled: true for dcgmExporter, which tells the GPU Operator to create a ServiceMonitor so that Prometheus on the managed cluster scrapes the DCGM exporter metrics. Without this, the DCGM metrics will not appear in ACM Observability.
|
3.4.3 - Advanced: Development Grafana Instance
For users who want to build dashboards interactively in a Grafana UI and then export them, ACM supports a "Development Grafana" instance. This is optional — the ConfigMap approach above is the recommended method for this workshop.
The tools are in the multicluster-observability-operator repository:
<hub> $ git clone --depth 1 https://github.com/stolostron/multicluster-observability-operator.git
<hub> $ cd multicluster-observability-operator/tools
<hub> $ bash setup-grafana-dev.sh --deploy
After deploying, log into the dev Grafana URL in your browser, then promote your user to admin:
<hub> $ bash switch-to-grafana-admin.sh kube:admin
You must log into the Dev Grafana in your browser before running switch-to-grafana-admin.sh. The script looks up your user in Grafana’s database — if you haven’t logged in, the user doesn’t exist yet.
|
Once you have created or modified dashboards in the dev instance, export them to production using:
<hub> $ bash generate-dashboard-configmap-yaml.sh "Your Dashboard Name"
<hub> $ oc apply -f your-dashboard-name.yaml -n open-cluster-management-observability
To clean up the dev Grafana instance:
<hub> $ bash setup-grafana-dev.sh --clean