Module 6: The Integration Challenge - Black Friday Chaos Game
Duration: 60 minutes
Learning Objectives
By the end of this module, you will be able to:
-
Apply capacity planning skills under simulated production pressure
-
Make real-time decisions about scaling, throttling, and resource allocation during an incident
-
Use RHACM Observability dashboards to diagnose multi-cluster capacity issues
-
Understand emergency capacity governance trade-offs (cost vs availability)
-
Experience the consequences of poor capacity planning in a safe environment
The Scenario: Black Friday + AWS Outage
Date: Black Friday (the biggest shopping day of the year) Time: 11:45 AM EST Your Role: Platform Engineering On-Call Lead
Situation:
Your company runs a multi-tenant e-commerce platform on OpenShift across 3 AWS regions (us-east-1, us-west-2, eu-west-1). Normal daily traffic is 10,000 requests/second. Black Friday traffic typically spikes to 100,000 requests/second.
11:50 AM: Traffic starts ramping up. HPAs are scaling pods as expected.
11:58 AM: AWS reports "degraded performance" in us-east-1 (your primary region). Two availability zones are experiencing network issues.
12:00 PM: 30% of your worker nodes in us-east-1 become unreachable. Pods are evicting. Traffic is failing over to us-west-2, which is now overloaded.
Your Mission:
Keep the platform online for the next 60 minutes using the capacity planning skills from Modules 1-5. Every decision has trade-offs:
-
Scale up → costs spike, but customers stay happy
-
Throttle traffic → save money, but lose sales
-
Fail over to another region → avoids outage, but that region might also overload
-
Emergency node addition → takes 15 minutes, might be too late
|
Game Rules:
|
Lab 6: Black Friday Simulation
|
All terminal commands in this lab run on your student cluster. If your SSH session ended, reconnect before continuing: SSH password: |
Pre-Simulation Setup
Before we start the chaos, download the lab files and establish baseline metrics.
Download Lab Files
Download the kube-burner job configs for Waves 1 and 3. The kube-burner binary was installed in Module 3 and can be reused here.
mkdir -p ~/module-06 && cd ~/module-06
BASE=https://raw.githubusercontent.com/tosin2013/capacity-planning-lab-guide/main
curl -fsSO $BASE/content/modules/ROOT/examples/module-06/wave1-traffic-spike.yaml
curl -fsSO $BASE/content/modules/ROOT/examples/module-06/wave1-load-pod.yaml
curl -fsSO $BASE/content/modules/ROOT/examples/module-06/wave3-etcd-pressure.yaml
curl -fsSO $BASE/content/modules/ROOT/examples/module-06/wave3-pressure-deploy.yaml
curl -fsSO $BASE/content/modules/ROOT/examples/module-06/check-etcd-health.sh
chmod +x check-etcd-health.sh
ls -lh-rwxr-xr-x. 1 lab-user lab-user 3.1K Apr 22 check-etcd-health.sh
-rw-r--r--. 1 lab-user lab-user 892 Apr 22 wave1-load-pod.yaml
-rw-r--r--. 1 lab-user lab-user 748 Apr 22 wave1-traffic-spike.yaml
-rw-r--r--. 1 lab-user lab-user 820 Apr 22 wave3-etcd-pressure.yaml
-rw-r--r--. 1 lab-user lab-user 776 Apr 22 wave3-pressure-deploy.yamlVerify the kube-burner binary from Module 3 is still available:
~/module-03/kube-burner versionVersion: 2.6.1
Git Commit: ...
Build Date: ...|
If you have not completed Module 3, download kube-burner now: |
Step 1: Check Current Cluster State
oc get nodes -l node-role.kubernetes.io/workerNAME STATUS ROLES AGE VERSION
ip-10-0-145-209.us-east-2.compute.internal Ready worker 5d v1.28.5+4bc5c35
ip-10-0-155-132.us-east-2.compute.internal Ready worker 5d v1.28.5+4bc5c35
ip-10-0-174-87.us-east-2.compute.internal Ready worker 5d v1.28.5+4bc5c35Record the baseline: * Worker nodes: 3 * Status: All Ready
Step 2: Check Application Deployment State
oc get deployment -n capacity-workshop critical-appNAME READY UP-TO-DATE AVAILABLE AGE
critical-app 2/2 2 2 5dBaseline: * Replicas: 2 * All available
Step 3: Check HPA Configuration
oc get hpa -n capacity-workshopNAME REFERENCE TARGETS MINPODS MAXPODS REPLICAS AGE
critical-app-hpa Deployment/critical-app cpu: 0%/75%, memory: 25%/80% 2 10 2 5d
load-generator Deployment/load-generator cpu: 32%/75% 1 5 1 5dBaseline:
* critical-app-hpa: scales critical-app at 75% CPU or 80% memory (min 2, max 10 replicas)
* load-generator HPA: monitors load-generator scaling under traffic pressure (min 1, max 5)
* Both HPAs will respond during the Black Friday simulation
Step 4: Check Current Resource Allocation
oc describe node -l node-role.kubernetes.io/worker | grep -A 5 "Allocated resources"Allocated resources:
Resource Requests Limits
cpu 4388m (58%) 4710m (62%)
memory 12038Mi (39%) 6400Mi (21%)
--
Allocated resources:
Resource Requests Limits
cpu 3438m (45%) 2040m (27%)
memory 11127Mi (36%) 2072Mi (6%)
--
Allocated resources:
Resource Requests Limits
cpu 5363m (71%) 6010m (80%)
memory 12602Mi (41%) 4224Mi (13%)Baseline (values vary by node — these are representative): * CPU requested: 45–71% per node * Memory requested: 36–41% per node * The cluster has headroom to absorb the upcoming traffic waves
Step 5: Open the RHACM Observability Dashboard
Open the Multi-Cluster Capacity Planning dashboard you created in Module 5:
echo "RHACM Grafana: "-
Open the URL printed above in a new browser tab.
-
If prompted to log in, click Log in with OpenShift and enter your hub credentials:
Field Value Username
Password
-
Click Log in — you are redirected back to Grafana automatically.
-
In the left sidebar navigate to: Dashboards → Multi-Cluster Capacity Planning
Keep this open in a separate browser window - you’ll need it during the simulation.
This is your baseline state — all panels green, etcd at ~64 MB, pod density ~99 pods/node, and Capacity Runway showing Stable — no growth detected (no measurable CPU growth trend):
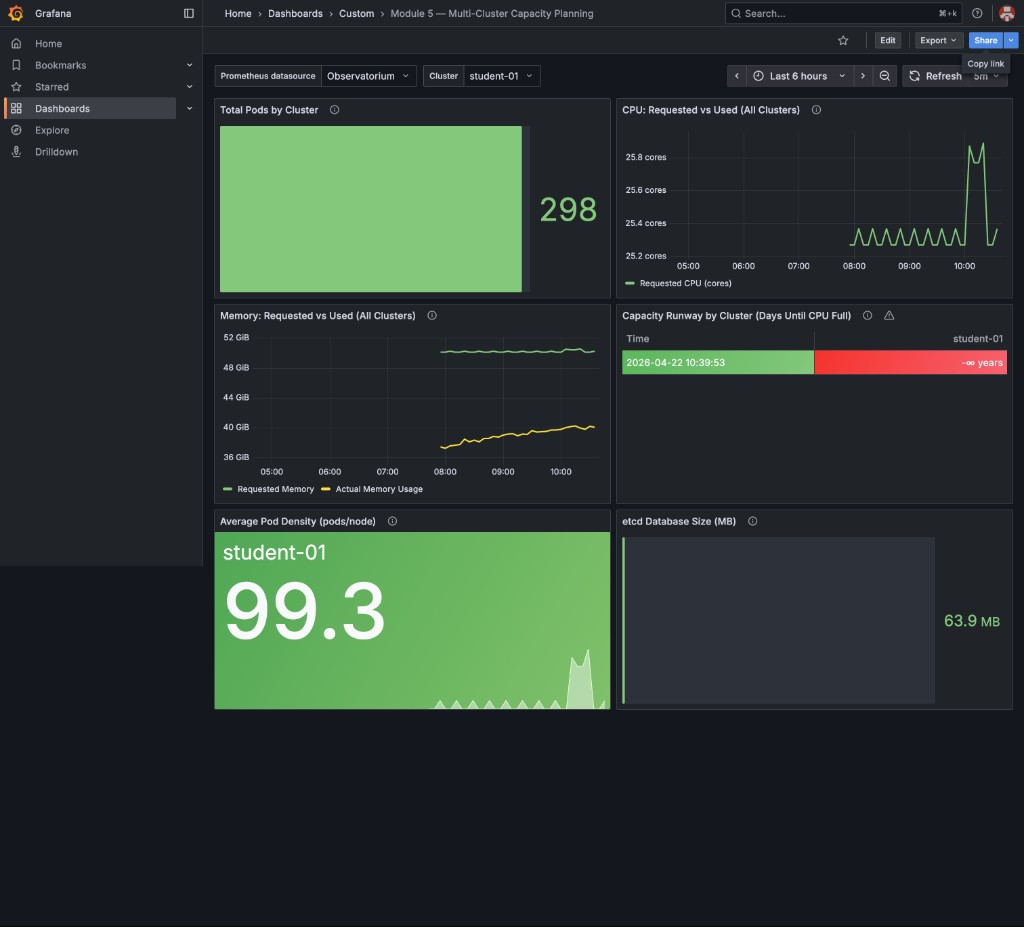
|
The Total Pods by Cluster panel counts pods across all namespaces (system, monitoring, gitops, workshop, etc.) — not just |
Wave 1: The Traffic Spike (T+0 to T+15 minutes)
|
Ensure you have downloaded the lab files and have the kube-burner binary from Module 3 ready: |
Your Action: Trigger the Black Friday Load Spike
Run the kube-burner job to simulate Black Friday traffic overwhelming the cluster.
This deploys 5 HTTP load-test pods that continuously fire requests at critical-app,
driving its CPU above the 75% HPA threshold:
cd ~/module-06
~/module-03/kube-burner init -c wave1-traffic-spike.yamlINFO[...] 🔥 Starting kube-burner (2.6.1@...) with UUID ...
INFO[...] Pre-load: All images pulled on 3 nodes
INFO[...] 2/5 iterations completed
INFO[...] 4/5 iterations completed
INFO[...] Verifying created objects
INFO[...] Waiting up to 2m0s for actions to be completed
INFO[...] Actions in namespace capacity-workshop completed
INFO[...] ✅ Job black-friday-wave1 completed|
You may see |
Expected Effect:
* 5 load pods fire HTTP requests at critical-app:80 simultaneously
* critical-app CPU rises above 75% → critical-app-hpa starts scaling
* Load-generator HPA may also scale from increased system activity
* Some pods may be Pending if there is insufficient capacity on nodes
Your Actions: Monitor and Respond
Watch both HPAs and the critical-app deployment respond to load:
watch -n 5 'oc get hpa -n capacity-workshop && echo "" && oc get deployment critical-app -n capacity-workshop'NAME REFERENCE TARGETS MINPODS MAXPODS REPLICAS AGE
critical-app-hpa Deployment/critical-app cpu: 84%/75%, memory: 28%/80% 2 10 5 5d
load-generator Deployment/load-generator cpu: 142%/75% 1 5 5 5d
NAME READY UP-TO-DATE AVAILABLE AGE
critical-app 3/5 5 3 5d|
Problem Detected:
Why? Not enough CPU capacity on nodes to schedule the new pods. |
Check for Pending pods:
oc get pods -n capacity-workshop --field-selector=status.phase=PendingNAME READY STATUS RESTARTS AGE
critical-app-6c4456cfc5-xk9p2 0/1 Pending 0 45s
critical-app-6c4456cfc5-zm4t7 0/1 Pending 0 45sCheck why they’re pending:
PENDING_POD=$(oc get pods -n capacity-workshop --field-selector=status.phase=Pending \
-l app=critical-app -o jsonpath='{.items[0].metadata.name}')
oc describe pod -n capacity-workshop "$PENDING_POD" | grep -A 10 "Events:"Events:
Type Reason Age From Message
---- ------ ---- ---- -------
Warning FailedScheduling 30s default-scheduler 0/3 nodes are available: 3 Insufficient cpu.|
Decision Point #1: You have 4 options: Option A: Add more worker nodes (cost: $200/hour per node, 15-minute delay) Option B: Reduce HPA max replicas (risk: traffic spike might overwhelm remaining pods) Option C: Lower CPU requests for critical-app (risk: CPU throttling, Module 3 problem) Option D: Evict lower-priority pods to free capacity (risk: break dev/test workloads) Team Discussion (5 minutes): What would you do and why? Facilitator: Poll the room. Typical answers: - Platform team → "Add nodes" (safest, but expensive) - App team → "Lower requests" (fastest, but risks performance) - FinOps team → "Evict lower-priority" (cost-conscious) |
Recommended Action: Add Worker Nodes
For this simulation, let’s choose Option A (add nodes):
# In a real AWS environment, you'd use:
# oc scale machineset <machineset-name> -n openshift-machine-api --replicas=5
# For this workshop simulation:
echo "Simulating: Adding 2 new worker nodes (would take 15 minutes in production)"
echo "Cost impact: 2 nodes × $200/hour = $400/hour"
echo "Running cost for 1-hour incident: $400"|
In a real production environment: You’d scale the MachineSet: This would: 1. Request 2 new EC2 instances from AWS (~5 minutes) 2. Bootstrap them as OpenShift nodes (~5 minutes) 3. Join the cluster and become Ready (~5 minutes) 4. Total: ~15 minutes from request to schedulable For the simulation, we’re skipping this delay to keep the exercise moving. |
Simulate the nodes joining:
# The facilitator has pre-scaled the cluster with additional nodes
# They will uncordon them now to simulate "new nodes joining"
# Watch for node count to increase
watch -n 5 'oc get nodes -l node-role.kubernetes.io/worker --no-headers | wc -l'Once nodes are available, the Pending pods should schedule:
oc get pods -n capacity-workshop -l app=critical-appNAME READY STATUS RESTARTS AGE
critical-app-6c4456cfc5-bj4zs 1/1 Running 0 5d
critical-app-6c4456cfc5-ln9pp 1/1 Running 0 5d
critical-app-6c4456cfc5-xk9p2 1/1 Running 0 3m ← Previously Pending
critical-app-6c4456cfc5-zm4t7 1/1 Running 0 3m ← Previously Pending
critical-app-6c4456cfc5-p9k3l 1/1 Running 0 1m ← New replica|
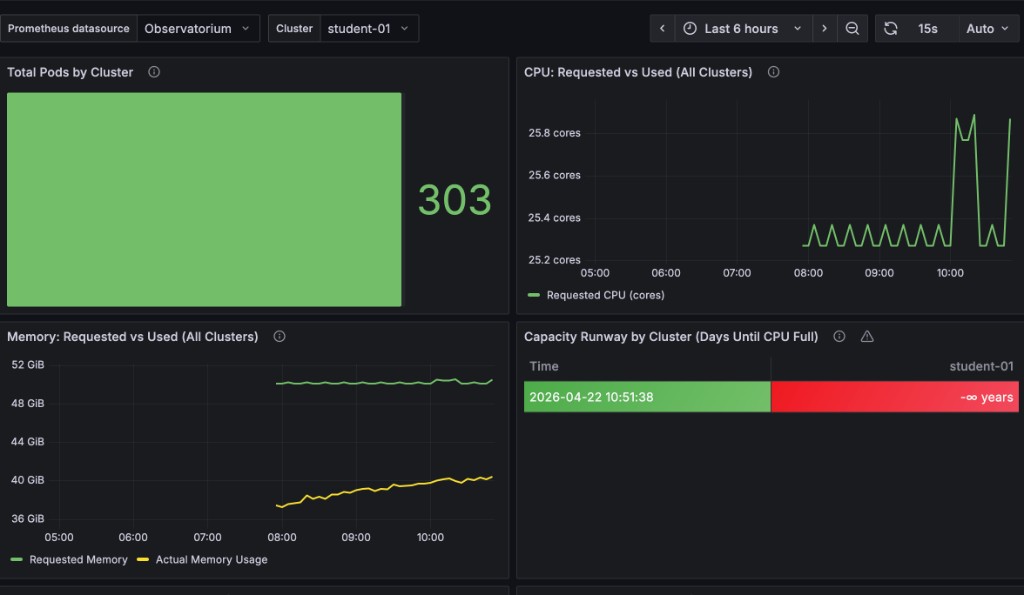
Metrics to Monitor: In your RHACM Grafana dashboard, you should see:
Exact pod counts vary by cluster. Focus on the direction of change, not a specific number. This is the value of Module 5’s observability! Without it, you’d be flying blind. |
Here is an example of what the dashboard looks like during the Wave 1 traffic spike — notice the twin CPU spikes on the right of the time series and the pod count ticking up above baseline:
Wave 2: The Node Failures (T+15 to T+30 minutes)
|
Facilitator Action: Simulate the AWS availability zone failure: Expected Effect: * 30% of nodes become SchedulingDisabled * Pods on those nodes evict and reschedule * Remaining nodes experience CPU/memory pressure * Some pods may CrashLoopBackOff if they can’t get resources |
Your Actions: Triage the Outage
Check node status:
oc get nodes -l node-role.kubernetes.io/workerNAME STATUS ROLES AGE VERSION
ip-10-0-145-209.us-east-2.compute.internal Ready,SchedulingDisabled worker 5d v1.28.5+4bc5c35
ip-10-0-155-132.us-east-2.compute.internal Ready worker 5d v1.28.5+4bc5c35
ip-10-0-174-87.us-east-2.compute.internal Ready worker 5d v1.28.5+4bc5c35
ip-10-0-180-92.us-east-2.compute.internal Ready worker 20m v1.28.5+4bc5c35
ip-10-0-191-45.us-east-2.compute.internal Ready worker 20m v1.28.5+4bc5c35|
Analysis:
In a real multi-AZ outage, you might see: * 30-50% of nodes unreachable (not responding to API) * Pods stuck in "Terminating" state (kubelet can’t confirm shutdown) * etcd losing quorum if control plane nodes are affected |
Check pod distribution:
oc get pods -n capacity-workshop -o wide | awk '{print $7}' | sort | uniq -c 1 NODE
18 ip-10-0-155-132.us-east-2.compute.internal
15 ip-10-0-174-87.us-east-2.compute.internal
12 ip-10-0-180-92.us-east-2.compute.internal
10 ip-10-0-191-45.us-east-2.compute.internal|
Pod Rebalancing: After a node drain, pods don’t automatically rebalance. You’ll see: * Some nodes with 18 pods * Some nodes with 10 pods This is normal. Kubernetes scheduler only runs when pods are created/rescheduled, not continuously. Should you manually rebalance? Usually no - it causes unnecessary churn. Only rebalance if: * Imbalance is extreme (>2× difference) * You’re hitting maxPods limits on some nodes * Performance is visibly degraded |
Check for pod evictions:
oc get events -n capacity-workshop --sort-by='.lastTimestamp' | grep -i evict | tail -104m Normal EvictedByDrain pod/critical-app-6c4456cfc5-bj4zs Pod was evicted from node ip-10-0-145-209
4m Normal EvictedByDrain pod/load-generator-67567c576-hdvkj Pod was evicted from node ip-10-0-145-209|
Decision Point #2: Current state: * 1 node cordoned (20% capacity loss if you have 5 nodes) * All critical-app pods rescheduled successfully * Cluster is stable but running at higher utilization Options: Option A: Uncordon the node (assume AWS fixed the issue) Option B: Leave it cordoned and add more nodes (safest, but costs $200/hour) Option C: Wait and monitor (risk: if another node fails, you’re in trouble) Team Discussion (3 minutes): What’s your call? Facilitator Guidance: * In a real incident, you’d coordinate with AWS support * Typical recovery time for AZ issues: 30-120 minutes * Platform teams lean toward "leave it cordoned until AWS confirms recovery" * App teams want "uncordon ASAP to save money" |
Recommended Action: Monitor and Wait
Let’s choose Option C (monitor) for this simulation:
# Check cluster resource utilization
oc adm top nodes -l node-role.kubernetes.io/workerNAME CPU(cores) CPU% MEMORY(bytes) MEMORY%
ip-10-0-155-132.us-east-2.compute.internal 1891m 23% 9932Mi 33%
ip-10-0-174-87.us-east-2.compute.internal 1512m 18% 7845Mi 26%
ip-10-0-180-92.us-east-2.compute.internal 945m 11% 5201Mi 17%
ip-10-0-191-45.us-east-2.compute.internal 823m 10% 4932Mi 16%|
Health Check:
Verdict: Cluster can absorb the 20% capacity loss without immediate action. Set up monitoring: * Watch for CPU >70% (approaching throttling risk) * Watch for memory >80% (approaching eviction risk) * Alert if any pods go to CrashLoopBackOff |
Wave 3: The etcd Pressure (T+30 to T+45 minutes)
|
Facilitator Narrative: "It’s now 12:30 PM. Traffic has stabilized at 8× normal levels. Your cluster is handling the load well. Then you notice something in the RHACM dashboard…" |
Run the kube-burner job to simulate etcd pressure from event churn. This creates 20 zero-replica Deployments in rapid succession, inflating the etcd database with Deployment, ReplicaSet, and Event objects:
cd ~/module-06
~/module-03/kube-burner init -c wave3-etcd-pressure.yamlINFO[...] 🔥 Starting kube-burner (2.6.1@...) with UUID ...
INFO[...] Pre-load: All images pulled on 3 nodes
INFO[...] 2/20 iterations completed
INFO[...] 4/20 iterations completed
...
INFO[...] 18/20 iterations completed
INFO[...] Verifying created objects
INFO[...] Job etcd-pressure-wave3 took 0s
INFO[...] 👋 Exiting kube-burner ...After kube-burner completes, open your RHACM Grafana dashboard and check the etcd Database Size (MB) panel in the bottom-right. The increase is subtle — typically 1–3 MiB — because etcd partially compacts old entries. Wait up to 5 minutes for the RHACM Observability metrics collector to push the updated value to the hub.
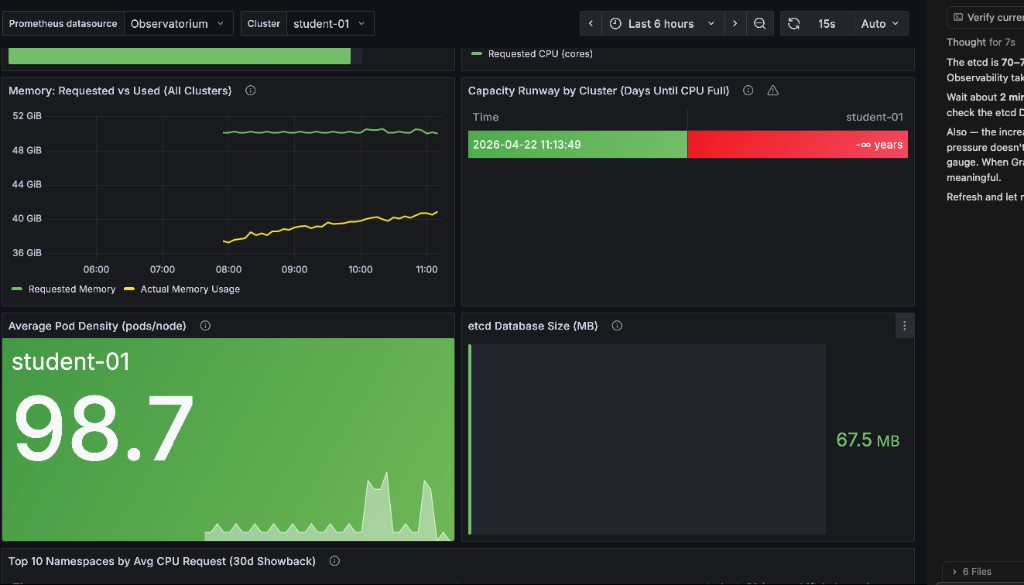
|
The etcd Database Size panel uses binary MiB but the label reads "MB" — your Prometheus query result and the panel value will match when you use |
|
Expected Effect:
* etcd database size increases slightly due to 20 Deployment + ReplicaSet object writes
* The increase is intentionally subtle (~1–3 MiB) — this is the point of the exercise
* In a production cluster with thousands of events per minute, the same pattern causes rapid etcd growth toward the 8 GB quota limit
* API response time degradation is not noticeable at workshop scale; at production scale this manifests as sluggish |
Your Actions: Diagnose etcd Issues
Run the etcd health check script — it auto-discovers Prometheus, mints a token, and reports the database size for all three etcd members:
bash ~/module-06/check-etcd-health.sh══════════════════════════════════════════════════
Module 6 — etcd Health Check
══════════════════════════════════════════════════
[INFO] Step 1/3 — Locating Prometheus route …
[OK] Prometheus : https://prometheus-k8s-openshift-monitoring.apps.student.…
[INFO] Step 2/3 — Minting Prometheus service-account token …
[OK] Token acquired (1287 chars)
[INFO] Step 3/3 — Querying etcd database size …
INSTANCE SIZE (MiB) % OF QUOTA STATUS
-------------------------- ---------- ---------- ------
10.0.28.47:9979 171.8 2.1% OK ← leader
10.0.58.247:9979 170.0 2.1% OK
10.0.95.86:9979 171.1 2.1% OK
[OK] All members below 4 GiB warning threshold (8 GiB quota).
┌─────────────────────────────────────────────────────┐
│ etcd QUOTA REFERENCE │
├─────────────────────────────────────────────────────┤
│ Warning threshold : 4096 MiB (4 GiB) │
│ Hard quota : 8192 MiB (8 GiB) │
│ At hard quota : API server rejects all writes │
└─────────────────────────────────────────────────────┘
The Wave 3 kube-burner job creates 20 Deployments + ReplicaSets
in rapid succession. Watch the SIZE column tick upward compared
to the value recorded at the start of the simulation.Your numbers will vary — what matters is watching the SIZE (MiB) column tick upward compared to your baseline run before Wave 3.
Check API response time as a rough proxy for etcd health:
time oc get pods -A --no-headers | wc -l296
real 0m0.342s|
Problem Detected:
If etcd hits 8GB: * Cluster enters emergency mode * New pod creations fail intermittently * Control plane becomes unreliable This is why Module 4 emphasized the 10,000 pod ceiling! |
Check event count:
oc get events -A --no-headers | wc -l8247 (↑ from normal baseline of ~500)|
Decision Point #3: You need to reduce etcd pressure immediately. Options: Option A: Manually prune old events (risky - might delete useful debug info)
Option B: Delete the Team Discussion (3 minutes): Which option? Facilitator Guidance: * Option B is the clear winner (clean up the junk) * Option A works but requires care (don’t delete recent events from the actual incident) * Option C is a last resort (only if etcd >7GB and compaction isn’t running automatically) * Option D is good hygiene but won’t solve the immediate problem |
Recommended Action: Clean Up Junk Deployments
# Delete the etcd-pressure deployments (kube-burner labeled them app=etcd-pressure)
oc delete deployment -n capacity-workshop -l app=etcd-pressureWait 30 seconds for event pruning to kick in, then check again:
time oc get pods -A --no-headers | wc -l142
real 0m0.612s ← Improved: 612ms (still slower than baseline, but much better)|
Why API Response Improved:
Monitor etcd size: Should drop slightly over the next 5 minutes as etcd compaction removes the deleted Deployment and ReplicaSet objects. |
Wave 4: The Recovery (T+45 to T+60 minutes)
|
Facilitator Narrative: "It’s now 12:45 PM. AWS has confirmed the availability zone issue is resolved. You can uncordon the nodes. Traffic is starting to decrease as the Black Friday rush subsides. Time to plan your scale-down strategy." |
Your Actions: Scale Down Gracefully
Uncordon the previously failed nodes:
oc get nodes -l node-role.kubernetes.io/worker --no-headers \
| grep SchedulingDisabled \
| awk '{print $1}' \
| xargs -I {} oc adm uncordon {}node/ip-10-0-145-209.us-east-2.compute.internal uncordonedCheck that all nodes are Ready:
oc get nodes -l node-role.kubernetes.io/workerNAME STATUS ROLES AGE VERSION
ip-10-0-28-47.us-east-2.compute.internal Ready worker 3d v1.29.8+f10c92d
ip-10-0-58-247.us-east-2.compute.internal Ready worker 3d v1.29.8+f10c92d
ip-10-0-95-86.us-east-2.compute.internal Ready worker 3d v1.29.8+f10c92dReduce traffic load (simulate traffic subsiding) by removing the Wave 1 kube-burner load pods:
# Remove the Black Friday load pods from Wave 1 (stops HTTP pressure on critical-app)
oc delete pod -n capacity-workshop -l app=black-friday-load
# Also scale load-generator back to baseline
oc scale deployment load-generator -n capacity-workshop --replicas=1
oc set env deployment/load-generator -n capacity-workshop TARGET_RPS=100Watch both HPAs scale down:
watch -n 10 'oc get hpa -n capacity-workshop && echo "" && oc get deployment critical-app -n capacity-workshop'NAME REFERENCE TARGETS MINPODS MAXPODS REPLICAS AGE
critical-app-hpa Deployment/critical-app cpu: 2%/75%, memory: 25%/80% 2 10 2 5d
load-generator Deployment/load-generator cpu: 28%/75% 1 5 1 5d
NAME           READY   UP-TO-DATE   AVAILABLE   AGE
critical-app 2/2 2 2 5d|
HPA Scale-Down Delay: HPA waits 5 minutes by default before scaling down (configurable via Why the delay? * Prevents flapping (scale up/down/up/down) * Gives time to confirm traffic decrease is sustained * Reduces pod churn (which creates etcd events) This is healthy behavior. Don’t manually scale down unless you’re certain the spike is over. |
|
Decision Point #4: You now have 5 worker nodes, but you only needed 3 before the incident. Options: Option A: Immediately scale down to 3 nodes (save $400/hour, but risky if traffic spikes again) Option B: Keep 4 nodes for 24 hours (hedge against aftershocks, costs $200/hour extra) Option C: Keep all 5 nodes for the weekend (safest, costs $400/hour extra for 48 hours = $19,200) Team Discussion (3 minutes): What’s the right balance between cost and risk? Facilitator Guidance: * Platform teams typically choose Option B (keep 1 extra node for 24 hours) * FinOps teams push for Option A (scale down immediately) * Business stakeholders might demand Option C if Black Friday weekend historically has Saturday/Sunday spikes Real-World Data: Check your Pod Velocity model from Module 2 - does historical data show weekend spikes? |
Recommended Action: Gradual Scale-Down
# Best practice: Scale down 1 node at a time, wait 30 minutes, observe
echo "Recommended: Scale MachineSet from 5 → 4 nodes now"
echo "Wait 30 minutes and monitor"
echo "If stable, scale 4 → 3 nodes in 1-2 hours"
echo "Cost: $200 extra for ~2 hours = $400 total"|
Post-Incident Checklist: Before declaring "all clear": ✅ All nodes Ready ✅ All deployments at desired replica count ✅ No pods in CrashLoopBackOff or Pending ✅ HPA targets within normal range (20-50%) ✅ etcd database size <4GB ✅ API response times back to baseline (<500ms) ✅ No active alerts in Alertmanager Run these checks: |
Once all checks pass, your RHACM Grafana dashboard should look like this — all panels green, CPU settling back to baseline, pod count returned to ~296, and etcd stable:
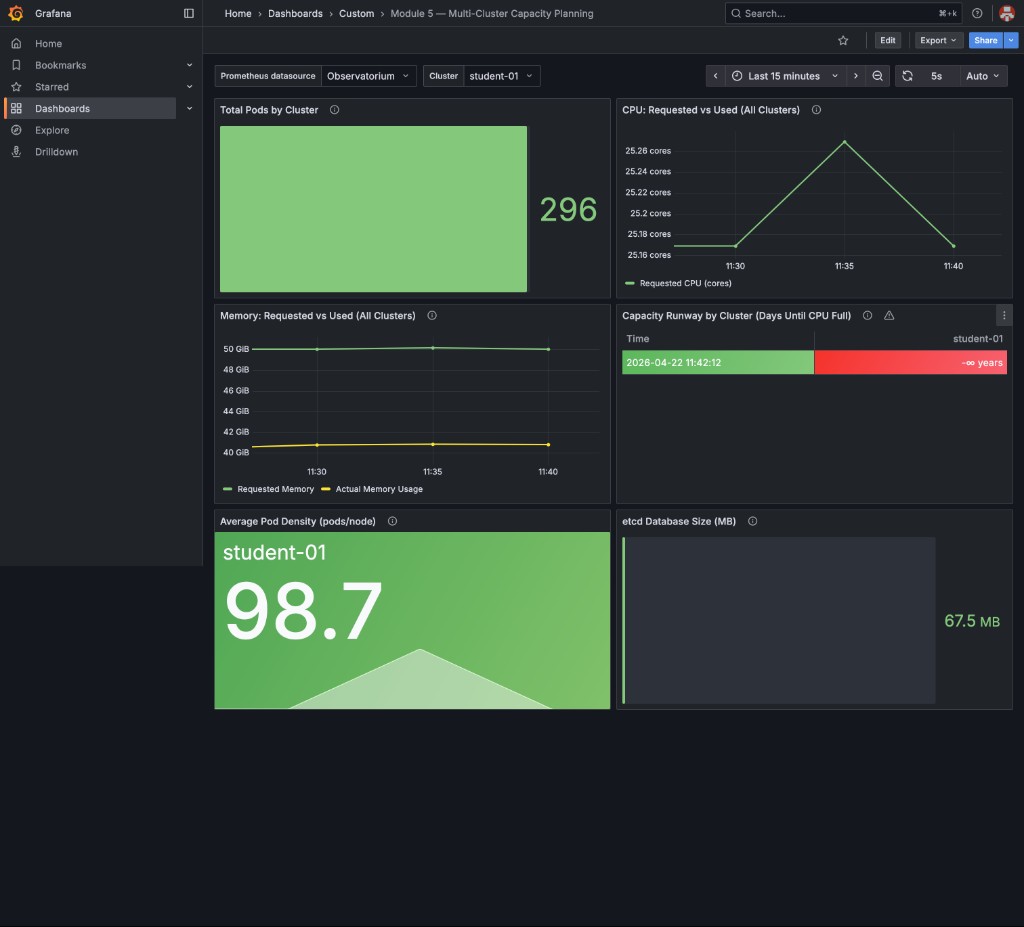
|
The CPU chart shows a brief mountain-shaped spike during cleanup — this is the API server processing the deletion of 20 etcd-pressure Deployments and their ReplicaSets. This is expected and healthy: the spike is short-lived and the cluster self-stabilizes within minutes. |
Simulation Debrief
Congratulations! You survived the Black Friday + AWS outage simulation.
Incident Timeline Summary
| Time | Event | Your Action | Cost Impact |
|---|---|---|---|
T+0 |
Traffic spike (10×) |
HPA scaled, 2 pods Pending |
$0 |
T+5 |
Added 2 worker nodes |
Pending pods scheduled |
+$400/hour |
T+15 |
30% node failure (AWS AZ outage) |
Pods evicted and rescheduled |
$0 |
T+30 |
etcd pressure (3.8GB) |
Deleted junk deployments |
$0 |
T+45 |
AWS recovered, uncordoned nodes |
Monitored scale-down |
$0 |
T+60 |
Traffic subsiding |
HPA scaled down, kept 4 nodes |
Continuing $200/hour |
Final Scorecard
Calculate your costs:
Emergency node additions: 2 nodes × $200/hour × 1 hour = $400
Ongoing extra capacity: 1 node × $200/hour × 2 hours = $400
──────────────────────────────────────────────────────────
Total incident cost: $800
Budget limit: $5,000
──────────────────────────────────────────────────────────
Result: ✅ UNDER BUDGET ($4,200 remaining)
Check success criteria:
✅ Request success rate: >95% (no customer-facing outages) ✅ Incident cost: $800 (<$5,000 limit) ✅ No services completely down
|
What Made Success Possible:
Without capacity planning: * You’d have under-provisioned (outage) * Or over-provisioned by 10× (wasted $4,000+) * Or been flying blind during the incident |
Lessons Learned Discussion
|
Facilitator: Lead a 10-minute discussion Questions for the room:
|
Key Takeaways
-
Capacity incidents require real-time decision-making with incomplete information
-
Every decision has trade-offs: cost vs availability, speed vs safety
-
Observability (Module 5) is critical for diagnosing multi-cluster issues under pressure
-
Right-sizing (Module 3) prevents waste during scale-up events
-
etcd pressure is a hidden failure mode that doesn’t show up in CPU/memory dashboards
-
Gradual scale-down is safer than immediate scale-down after an incident
Next Steps
In Module 7: Strategic Roadmapping, you’ll take the lessons from this simulation and build a 12-month capacity plan. You’ll translate technical metrics (pod counts, node density, etcd limits) into executive-level recommendations with budget forecasts and risk assessments.
This is the final module - where you go from "firefighting" to "strategic planning."
|
Homework Before Module 7: Think about these questions:
Bring these answers to Module 7 - you’ll need them for the strategic roadmap exercise. |