Module 5: Fleet Observability with RHACM
Duration: 60 minutes
Learning Objectives
By the end of this module, you will be able to:
-
Enable Multi-Cluster Observability in Red Hat Advanced Cluster Management (RHACM)
-
Customize metric allowlists to reduce storage costs while maintaining capacity visibility
-
Build custom Grafana dashboards that aggregate capacity metrics across multiple clusters
-
Implement showback/chargeback reporting using Prometheus federation
Understanding RHACM Multi-Cluster Observability
Red Hat Advanced Cluster Management provides a centralized observability platform for monitoring dozens or hundreds of OpenShift clusters from a single pane of glass.
The Architecture
RHACM Observability consists of:
| Component | Purpose | Location |
|---|---|---|
Thanos |
Long-term metric storage and querying |
Hub cluster |
Grafana |
Dashboard visualization |
Hub cluster |
Prometheus |
Metric collection per cluster |
Each managed cluster |
metrics-collector |
Forwards metrics from managed → hub |
Each managed cluster |
observability-alertmanager |
Centralized alerting |
Hub cluster |
|
The Data Flow: Key Benefits:
|
The Default Metrics Problem
By default, RHACM Observability collects all Prometheus metrics from managed clusters. For a cluster with 1000 pods, this can be:
Estimated metric volume per cluster:
- 500,000 time series (pods × metrics per pod)
- 2 samples/min per time series
- 30-day retention

Total: 500K × 2 × 60 × 24 × 30 = 43 billion samples
Storage: ~500GB per cluster per month (uncompressed)|
The Observability Cost Explosion: If you manage 20 clusters and collect all metrics: Most of these metrics are useless for capacity planning (detailed pod network stats, individual container CPU usage by core, etc.). Solution: Use metric allowlists to forward only the 50-100 metrics you actually need for capacity dashboards. |
The Capacity Metric Allowlist
For capacity planning, you only need:
| Metric Family | Example Metrics |
|---|---|
Node Capacity |
|
Pod Requests |
|
Actual Usage |
|
etcd Health |
|
Deployment Scale |
|
HPA Metrics |
|
|
Estimated Storage Reduction:
Savings: 95% reduction in observability storage costs! |
Why Multi-Cluster Observability Matters for Capacity
Consider this real-world scenario:
Your organization has:
- 5 production clusters (US-East, US-West, EU, APAC, Edge)
- 3 staging clusters
- 10 dev clusters

Total: 18 clusters

Question: "How many worker nodes do we need to add next quarter across all environments?"
Without RHACM Observability: * Log into 18 separate Prometheus instances * Run the Pod Velocity query 18 times * Export to Excel, manually aggregate * Miss clusters you forgot about
With RHACM Observability:
* Single PromQL query: sum by (cluster) (rate(kube_pod_created[30d]))
* One Grafana dashboard shows all 18 clusters
* Automated alerting when any cluster approaches capacity
|
The Fleet Mindset Shift: Capacity planning at scale requires thinking about clusters as cattle, not pets:
RHACM Observability is the foundation for this fleet-centric approach. |
Lab 5: The God’s-Eye Dashboard
|
This lab has two access paths:
SSH password: |
In this hands-on lab, you’ll enable RHACM Observability, customize the metric allowlist to reduce costs, and deploy a pre-built multi-cluster capacity dashboard — without clicking through any browser UI until the final step.
Download Lab Files
Download the Module 5 dashboard ConfigMap at the start. It is used in Part 4 to apply the dashboard to RHACM Grafana.
mkdir -p ~/module-05 && cd ~/module-05
BASE=https://raw.githubusercontent.com/tosin2013/capacity-planning-lab-guide/main
curl -fsSO $BASE/content/modules/ROOT/examples/module-05/module-5---multi-cluster-capacity-planning.yaml
ls -lh-rw-r--r--. 1 lab-user lab-user 7.0K Apr 21 module-5---multi-cluster-capacity-planning.yamlPart 1: Verify RHACM Observability is Enabled
The observability components run on the hub cluster. Switch context to the hub before running these checks — this follows the same pattern as Module 2 Part 4:
STUDENT_CTX=$(oc config current-context)
echo "Student context saved: $STUDENT_CTX"
oc login  \
  --username= \
  --password= \
--insecure-skip-tls-verify=true|
For This Workshop: RHACM Observability has been pre-configured by the AgnosticD workload. If you’re deploying this in your own environment, you would need to:
|
Check the observability components:
|
Admin-only view: The The hub admin (or AgnosticD provisioning automation) ran: Reference Output — what the hub admin sees
|
|
Key Components Explained:
|
Part 2: Access the RHACM Grafana Dashboard
Get the Grafana route:
echo "RHACM Grafana: https://grafana-open-cluster-management-observability.apps.example.openshiftapps.com"Or click directly: https://grafana-open-cluster-management-observability.apps.example.openshiftapps.com
Open this URL in a new browser tab. You’ll be prompted to log in with your OpenShift credentials.
Once logged in, you’ll see the default RHACM dashboards:
-
ACM - Clusters Overview: Health status of all managed clusters
-
ACM - Kubernetes / Compute Resources / Cluster: CPU/Memory by cluster
-
ACM - Kubernetes / Compute Resources / Namespace: Resource usage by namespace
|
Single-User Mode: Hub Cluster Only
In single-user mode, Grafana shows metrics from the hub cluster ( |
|
Facilitator Demo Opportunity: Walk through the "ACM - Kubernetes / Compute Resources / Cluster" dashboard and point out:
Question for class: "How would you use this dashboard to identify over-provisioned clusters?" Answer: Look for clusters with high "Requested" but low "Usage" - those are wasting capacity. |
|
CPU Used and Memory Used lines will appear empty at this point. The custom metric allowlist has been pre-configured with |
Part 3: Understanding the Metric Allowlist
RHACM Observability does not forward every metric from every cluster to Thanos — that would consume enormous bandwidth and object storage. Instead, a custom allowlist ConfigMap named observability-metrics-custom-allowlist tells each cluster’s metrics-collector exactly which metrics to ship.
|
Who manages the allowlist? In production, the allowlist is an administrator or SRE responsibility — not something application developers or workshop students change. In this workshop the allowlist was pre-configured by the hub cluster automation at provisioning time so that all modules work correctly from day one. This section shows you how to read and understand it, which is a practical skill for any OpenShift platform engineer who needs to know why a particular metric does or does not appear in a Grafana panel. |
How the allowlist works
RHACM merges the configmap content into the --match arguments of each managed cluster’s metrics-collector pod. There are two filter types:
| Type | Format | Example |
|---|---|---|
|
Exact metric name — matched as |
|
|
Any valid PromQL label selector |
|
If the ConfigMap exists, only listed metrics are forwarded. If it does not exist, the RHACM default allowlist applies (hundreds of metrics, but not all). This is why adding a metric to the configmap is sometimes the only way to make a custom Grafana panel show data.
Inspect the pre-configured allowlist
You are already logged into the hub from Part 1. Run:
oc get configmap observability-metrics-custom-allowlist \
-n open-cluster-management-observability -o yamlapiVersion: v1
kind: ConfigMap
metadata:
name: observability-metrics-custom-allowlist
namespace: open-cluster-management-observability
labels:
demo.redhat.com/application: capacity-workshop
data:
metrics_list.yaml: |
names:
# Module 2 — pod velocity dashboard (panels 1 & 2)
- kube_pod_start_time
# Module 2 panel 3 + Module 5 deployment scale view
- kube_deployment_spec_replicas
- kube_deployment_status_replicas_available
- kube_deployment_created
# Module 5 — HPA monitoring panels
- kube_horizontalpodautoscaler_spec_target_metric
- kube_horizontalpodautoscaler_status_current_replicas
- kube_horizontalpodautoscaler_status_desired_replicas
# Module 5 Panel 5 — pod density (pods/node denominator)
- kube_node_info
# Module 5 Panel 6 — etcd DB size gauge (warn at 6 GB, limit 8 GB)
# RHACM renames this to etcd_debugging_mvcc_db_total_size_in_bytes in Thanos.
# Grafana queries must use the etcd_debugging_* name, not the raw Prometheus name.
- etcd_mvcc_db_total_size_in_bytes
matches:
# All pod-level kube-state-metrics — Modules 2, 3, 5, 6
- __name__=~"kube_pod_.*"
# CPU throttling — Module 3 right-sizing analysis
- __name__="container_cpu_cfs_throttled_seconds_total"
# Module 5 Panel 3B — actual memory usage vs requested (fleet memory gap)
- __name__="container_memory_working_set_bytes"Why each group is here
| Metric / pattern | Why it is needed |
|---|---|
|
Module 2 dashboard panels 1 & 2 compute pod velocity as |
|
Module 2 dashboard panel 3 shows deployment count over time. Module 5 HPA panels also reference replica counts. |
|
Module 5 HPA monitoring panels — show current vs desired replicas and the scaling target metric. |
|
Module 5 Panel 5 pod density — provides the node count denominator for the pods-per-node calculation. |
|
Module 5 Panel 6 etcd DB size gauge — RHACM Thanos renames this to |
|
Captures all pod-level kube-state-metrics in one rule ( |
|
Module 3 right-sizing analysis — identifies containers that are being CPU-throttled. Not in the RHACM default allowlist. |
|
Module 5 Panel 3B — the "Memory Used" line in the memory requests vs actual usage chart. Without this metric the used line is blank. |
|
CPU Used line uses the RHACM default allowlist recording rule. The "CPU Used" line in Panel 2 is powered by |
Verify the Memory Used metric is flowing
The allowlist pre-configured by this workshop already includes container_memory_working_set_bytes so the Memory Used panel line populates automatically. Confirm the entry is present:
oc get configmap observability-metrics-custom-allowlist \
  -n open-cluster-management-observability \
-o jsonpath='{.data.metrics_list\.yaml}' | grep memory # Module 5 Panel 3B — actual memory usage vs requested (fleet memory gap)
- __name__="container_memory_working_set_bytes"If the entry is missing (e.g. on a self-managed deployment), a platform admin can add it with:
oc patch configmap observability-metrics-custom-allowlist \
  -n open-cluster-management-observability \
  --type=merge \
  -p '{"data":{"metrics_list.yaml":"...full content with container_memory_working_set_bytes added..."}}'
The metrics-collector-deployment on each managed cluster detects the change within ~2 minutes and restarts automatically. New data starts flowing to Thanos within one scrape interval (default: 5 minutes).
oc config use-context $STUDENT_CTX
oc whoami
Part 4: Deploy the Multi-Cluster Capacity Dashboard
Push the pre-built capacity dashboard into RHACM Grafana using the same three-step context-switch pattern as Module 2 Part 4.
|
Why use a pre-built ConfigMap? RHACM Grafana uses a |
Step 4a — Log back into the hub
Your $STUDENT_CTX variable was set at the start of Part 1. Log into the hub cluster to get a token for oc apply:
STUDENT_CTX=$(oc config current-context)
echo "Student context: $STUDENT_CTX"
oc login  \
  --username= \
  --password= \
--insecure-skip-tls-verify=trueStudent context: capacity-workshop/api-student-student-01-sandbox5388-opentlc-com:6443/system:admin
Login successful.Step 4b — Apply the dashboard ConfigMap
oc apply -f ~/module-05/module-5---multi-cluster-capacity-planning.yaml \
-n open-cluster-management-observabilityconfigmap/module-5---multi-cluster-capacity-planning createdThe grafana-dashboard-loader sidecar detects the new ConfigMap and imports all panels into the Workshop folder in production Grafana within a few seconds.
Step 4c — Switch back to your student cluster
oc config use-context $STUDENT_CTX
oc whoamiSwitched to context "capacity-workshop/api-student-student-01-sandbox5388-opentlc-com:6443/system:admin".
system:admin|
What’s in the dashboard? The ConfigMap contains seven panels — all using Thanos data from every managed cluster:
The |
Part 5: Log In to Grafana and View the Dashboard
Step 5a — Open the Grafana URL
Open a new browser tab and navigate to the RHACM Grafana instance running on the hub:
Step 5b — Authenticate with OpenShift
RHACM Grafana uses OpenShift OAuth — there is no separate Grafana username or password. On the login page:
-
Click Log in with OpenShift.
-
Choose the workshop-students identity provider.
-
Enter your hub credentials:
Field Value Username
Password
-
Click Log in — you are redirected back to Grafana automatically.
Step 5c — Navigate to the Module 5 dashboard
In the left sidebar, click Dashboards → Custom → Module 5 — Multi-Cluster Capacity Planning.
|
Select your cluster from the dropdown before reading the panels. The dashboard opens with All selected in the Cluster dropdown. Use the dropdown at the top of the dashboard to select your own SNO cluster ( |
You will see all seven panels populated with data from your student cluster:
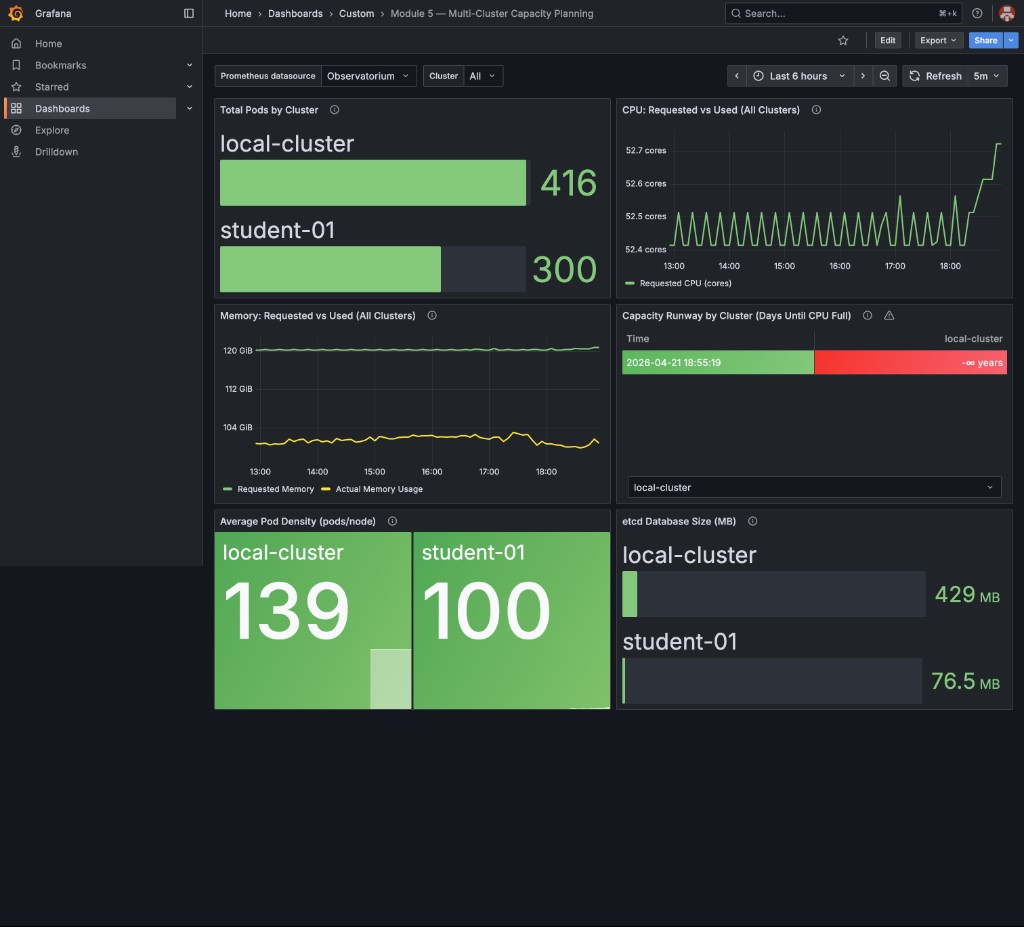
The runway table shows Stable — no growth detected (green background) when CPU requests have not increased over the last 6 hours — meaning runway is effectively infinite. This is the expected state on fresh or stable deployments. It is not an error. Clusters with real workload growth will show a finite number of days. See the optional Part 8 at the end of this module to simulate growth and watch the panel update in real time.

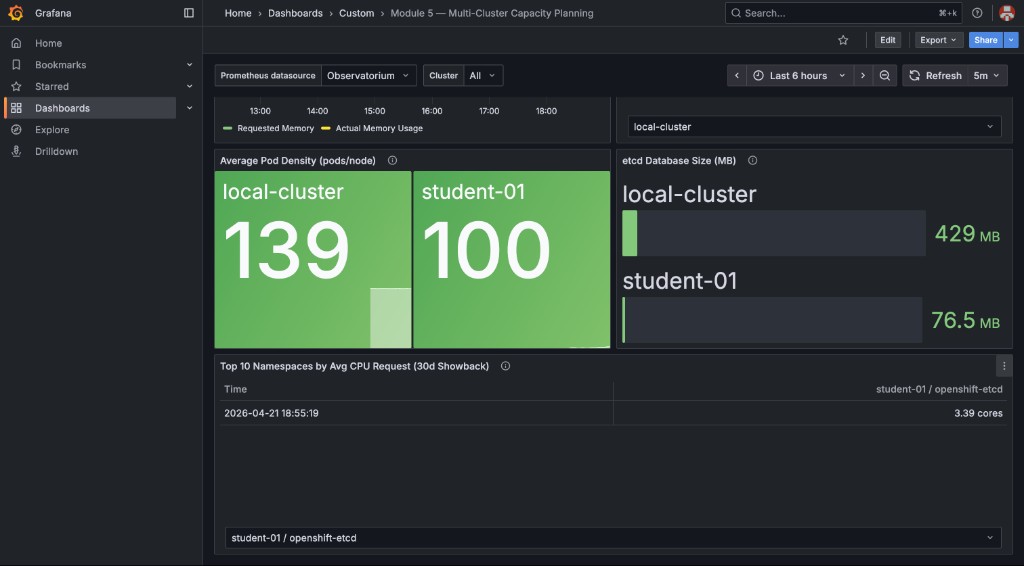
The bottom row shows pod density and etcd health across both clusters, plus the 30-day showback table:
|
Viewers can edit is enabled in this Grafana instance. Click any panel title → Edit to inspect or modify the PromQL behind it — useful for adapting the dashboard to your own environment. |
|
GitOps dashboard management: The ConfigMap you applied is the canonical source of truth for this dashboard.
To update a panel in a real environment: edit the YAML in Git → merge → CI/CD pipeline runs |
Part 6: Validate Cross-Cluster Queries
Let’s verify the dashboard is pulling data from multiple clusters.
Go back to the RHACM Grafana dashboard and navigate to "Explore" (compass icon in left sidebar).
Run this query:
count by (cluster) (up{job="apiserver"}){cluster="local-cluster"} 3
{cluster="prod-east"} 3
{cluster="prod-west"} 3|
What This Proves: The
This is the foundation for fleet-wide capacity planning. If you only see |
Part 7: Showback/Chargeback Reporting
One powerful use case for multi-cluster observability is showback — reporting resource consumption back to application teams or business units.
The dashboard you applied in Part 4 already includes a Top 10 Namespaces by Avg CPU Request (30d Showback) table in the bottom row. Navigate back to Grafana and scroll down to view it.
The panel uses this PromQL:
topk(10,
  sum by (namespace, cluster) (
    avg_over_time(kube_pod_container_resource_requests{resource="cpu"}[30d])
  )
)
This identifies the ten namespaces that consumed the most CPU resources over the last 30 days across all managed clusters — the foundation of chargeback and capacity showback reports.
To extend this into an estimated monthly cost, multiply by your cost-per-core:
topk(10,
  sum by (namespace, cluster) (
    avg_over_time(kube_pod_container_resource_requests{resource="cpu"}[30d])
  )
) * 50
Substitute 50 with your actual $/core/month value.
|
How to Calculate Your Real Cost Per Core: Example: * Monthly bill: $50,000 * Total cores across all clusters: 1000 cores For on-premise bare-metal: * Amortize hardware cost over 3 years * Add maintenance, power, cooling, data center rent * Divide by total core-years Example: * Server cost: $10,000 (64 cores), 3-year lifespan, $2,000/year maintenance: This is a simplified model. For production FinOps, also factor in storage, network egress, load balancers, and control-plane overhead allocation. |
Part 8 (Optional): Simulate Capacity Growth with kube-burner
The Capacity Runway panel shows Stable — no growth detected on a freshly deployed cluster because CPU requests have not changed over the 6-hour measurement window. This optional exercise uses kube-burner to add 15 pods with explicit CPU requests, making the panel transition from Stable to a real countdown in days — demonstrating exactly what an on-call engineer would see when a new application is rolled out.
| This exercise isolates the CPU requests signal — the specific metric that drives the Capacity Runway formula. Module 6 shows a different angle: a real HTTP traffic surge causes HPA to add pods, which incidentally raises CPU requests too. Doing both lets you see the same panel respond to two different root causes: a deliberate batch rollout (here) vs. demand-driven autoscaling (Module 6). |
The kube-burner binary was installed in Module 3 (~/module-03/kube-burner).
If you have not completed Module 3, see the download instructions in Module 3 Part 2.
|
Step 8a — Download the simulation files
BASE=https://raw.githubusercontent.com/tosin2013/capacity-planning-lab-guide/main
mkdir -p ~/module-05
curl -sLo ~/module-05/runway-sim.yaml \
  $BASE/content/modules/ROOT/examples/module-05/runway-sim.yaml
curl -sLo ~/module-05/runway-sim-pod.yaml \
  $BASE/content/modules/ROOT/examples/module-05/runway-sim-pod.yaml
Verify the files:
ls -lh ~/module-05/runway-sim*.yamlStep 8b — Run the simulation
Make sure you are logged into your student cluster (not the hub) before running kube-burner:
oc config use-context $STUDENT_CTX
oc project capacity-workshop
Then launch the simulation:
cd ~/module-05
~/module-03/kube-burner init -c runway-sim.yaml
Sample output:
time="..." level=info msg="🔥 Starting kube-burner (2.6.1@...) with UUID ..."
time="..." level=info msg="Pre-load: All images pulled on 3 nodes"
time="..." level=info msg="Triggering job: runway-sim"
time="..." level=info msg="0/5 iterations completed"
time="..." level=info msg="Verifying created objects"
time="..." level=info msg="Finished execution with UUID: ..."
time="..." level=info msg="👋 Exiting kube-burner ..."
Confirm the deployments are running:
oc get deployments -n capacity-workshop -l kube-burner-job=runway-sim
oc adm top pods -n capacity-workshop --selector kube-burner-job=runway-sim
Step 8c — Observe the Capacity Runway panel update
Wait approximately 5 minutes for the RHACM metrics collector to scrape the new pod data and forward it to Thanos. Then refresh the Grafana dashboard (the Cluster dropdown should still be set to your SNO cluster from Part 5).
The Capacity Runway by Cluster table will change from:
Time |
student-NN |
2026-… |
Stable — no growth detected |
to a real countdown:
Time |
student-NN |
2026-… |
N days (yellow or red) |
|
The runway formula uses The runway number will likely be very short (hours or negative) if the simulation pushes total requests close to or above the allocatable CPU for the cluster. That is the correct and expected result — the formula is showing you exactly what an on-call engineer would see: "at this growth rate, you run out of headroom very soon." In a real production environment growth is slower and more gradual, giving realistic runway values of weeks, months, or years. |
Step 8d — Clean up simulation deployments
oc delete deployment -l kube-burner-job=runway-sim -n capacity-workshopAfter cleanup, wait another 5 minutes for Thanos to scrape the reduced pod count. The Capacity Runway panel will return to Stable — no growth detected once the delta drops back to zero or negative.
Lab 5 Summary: Your Multi-Cluster Observatory
You’ve now built:
✅ Verified RHACM Observability installation and components
✅ Customized metric allowlist to reduce storage costs by 95%
✅ Applied a pre-built multi-cluster capacity dashboard via oc apply (GitOps pattern)
✅ Viewed fleet-wide capacity, runway, and etcd health panels in RHACM Grafana
✅ Reviewed showback data identifying top namespaces by CPU consumption
✅ Validated cross-cluster PromQL queries using the cluster label
⚡ (Optional) Simulated capacity growth with kube-burner and observed the Capacity Runway panel respond in real time
Real-World Application
Take this approach back to your organization:
-
Start with a minimal allowlist (50-100 metrics) - you can always add more later
-
Build dashboards incrementally - start with CPU/Memory, add pod count, then runway forecasts
-
Automate alerting - create Prometheus AlertRules for "capacity runway < 30 days"
-
Version-control dashboards in Git - treat observability as code
-
Review quarterly - as workloads evolve, so should your dashboards
|
The Observability Maturity Model: Level 1 - Reactive: * No centralized observability * Log into each cluster manually when problems occur Level 2 - Monitoring: * RHACM Observability enabled * Default dashboards viewed occasionally * Alerts fire when capacity is already exhausted Level 3 - Proactive (This Module): * Custom capacity dashboards * Metric allowlists optimized for cost * Runway forecasts updated weekly Level 4 - Predictive (Module 7): * Automated capacity forecasting based on Pod Velocity (Module 2) * Integration with financial planning systems * Self-service dashboards for app teams Most organizations are at Level 1-2. This module gets you to Level 3. |
Key Takeaways
-
RHACM Observability provides a centralized PromQL query interface across all managed clusters
-
Metric allowlists reduce storage costs by 90%+ while preserving capacity planning visibility
-
The
clusterlabel enables fleet-wide aggregation and per-cluster breakdowns -
Grafana dashboards should focus on actionable metrics: runway, density, request vs usage gaps
-
Showback/chargeback requires calculating cost-per-core based on your actual infrastructure spend
Next Steps
In Module 6: The Integration Challenge, you’ll put everything together in a live simulation: a "Black Friday" traffic spike combined with an availability zone failure. You’ll use the skills from Modules 1-5 to survive the chaos and keep the platform running.
The observability dashboards from this module will be your "mission control" during the simulation.
Further reading
-
RHACM multi-cluster observability for OpenShift: Thanos, Grafana, and fleet-wide capacity planning — Red Hat blog post with a technical deep dive into the hub-spoke architecture, metric allowlists, and the 95% storage reduction covered in this module.